PVSR
Performance monitoring
Performance monitoring of IT services for service providers and users of these services
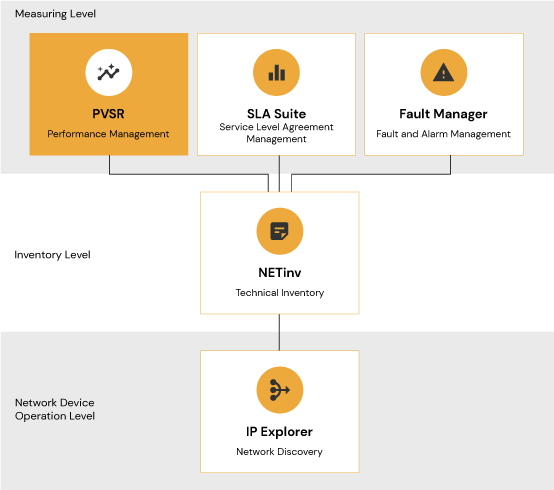
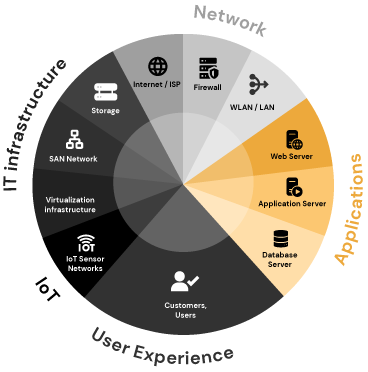
PVSR (longer name: PerformanceVisor) is a unified performance monitoring platform that is used to comprehensively monitor the quality and performance of services, starting from the end-user experience, through applications, IT infrastructures and networks. PVSR allows us to measure all parameters that affect the quality of the service provided: it examines the actual end-user experience, and also whether the components of the IT service are available and, if so, with what performance they perform their tasks.
Such components:
- the applications,
- the databases,
- operating systems (Windows, Linux & * nix)
- the virtualized layer (VMware & Hyper – V),
- physical infrastructures, storage devices,
- (SAN) networks built from storage devices,
- and wide area networks (LAN/ WAN).
- IoT sensor networks
PVSR product page available here.
Try online demo here!
Main features of PVSR
Multi – tenant solution, with an architecture capable of working in several separate networks
Monitoring of up to millions of parameters of more than 10,000 devices
Self-testing to detect system faults
A wide range of threshold assessments adjustable on a wide scale (trend, baseline, moving window, maintenance window)
Real-time monitoring with a resolution of up to one second can be switched on
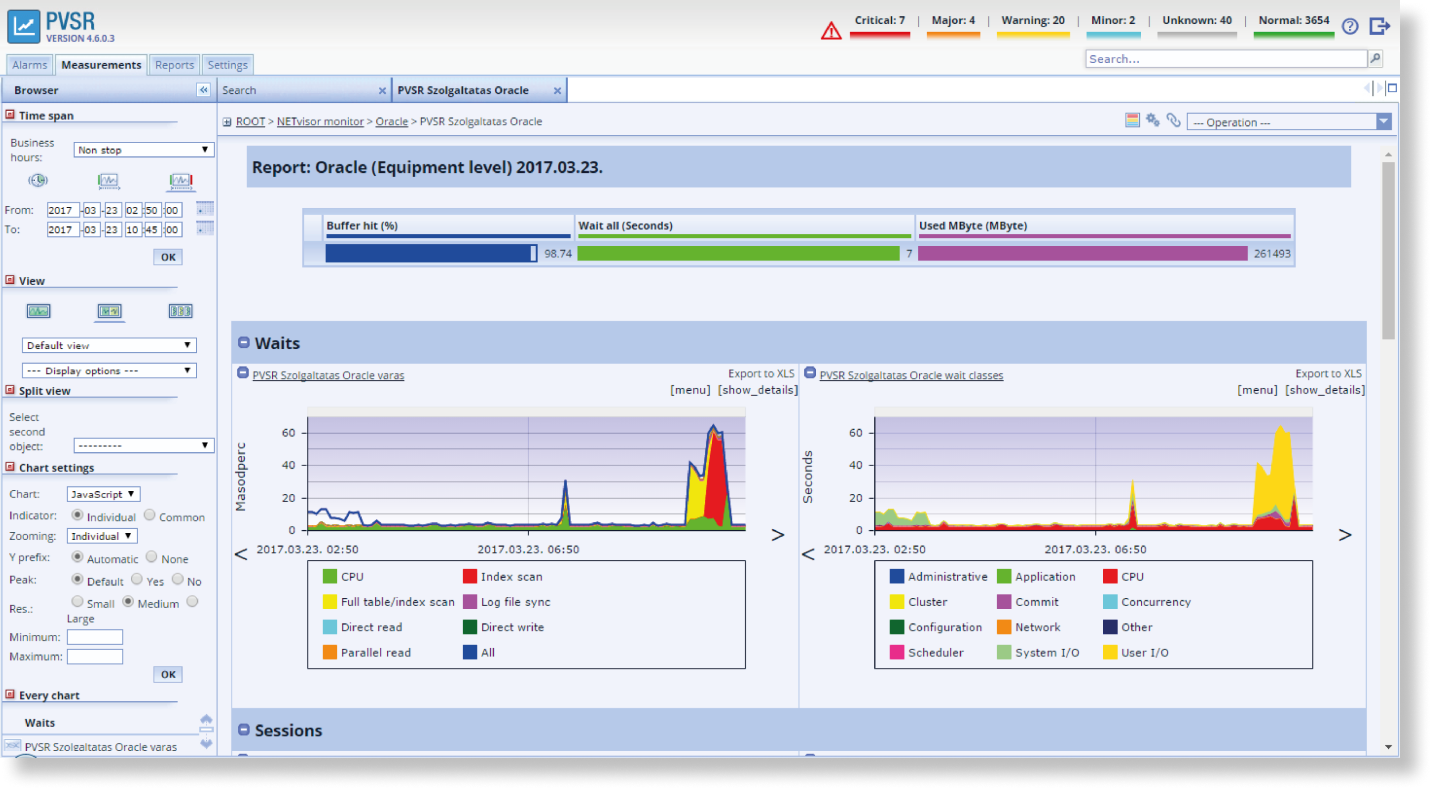
Diagnostic pages that go beyond measurements (e.g. queries of database connections)
Precalculated reports provide a comprehensive picture of the entire monitored system
Ad-hoc reports to help limit faults
It automatically detects the parameters that can be monitored
Mass configuration using templates
Ergonomic user interface with interactive graphs, customizable measurement grouping
Android client
Grafana plugin: easy-to-use free dashboard
Advantages of using PVSR
You can see everything on one unified interface
The operational efficiency of ICT systems can be increased with the PVSR system by allowing you to monitor the entire range of ICT services on a single unified interface.
The system gives a comprehensive picture of ICT services and all the elements that make them up. Unique built-in diagnostic tools allow you to drill down to detailed information without having to launch and enter each of the management tools provided by different manufacturers. This unified and comprehensive picture within a monitoring system enables you to immediately detect correlations between different system elements.
Proactive problem solving, accelerated diagnostics
PVSR provides a solution that simplifies the complexity of fault detection, which not only continuously monitors the end-user experience and perform precise measurements on the elements that make up the ICT service, but in the event of a decrease in performance, it even issues an external alarm before the customer complains.
In addition, with the help of unique built-in diagnostic tools, it can shorten the time to identify the fault, so that the problems that arise can often be solved before the customers would even realize them.
Comprehensive, real-time control over the performance of IT services
PVSR can be used to create a comprehensive real-time monitoring of mission-critical applications and IT services.
With PVSR user experience can be monitored and the exact performance and availability of the elements that make up your IT services can be measured.
Cost reduction through better resource utilization
PVSR easily detects unused resources or bottlenecks. With its help, you can optimize your business applications and infrastructure and make better use of your available resources.
You can optimize your virtual infrastructure, storage devices, network load, and cloud-based resources. PVSR is capable of analyzing the collected data over time and thus trends can be recognized, as well as capacity reports can be prepared that show in advance what resources will be needed in the future.


